Pies charts are fun to use, but it’s almost impossible for grown-ups to find a good reason for using them at work. So your first, safe-for-work choice is a bar chart. The boring bar chart.
I don’t like bar charts. There, I said it.
This is a little rant about bar charts, but also about the Eurostat. One of my first posts in this blog was an “open letter” to Mr. Hervé Carré the (then) Director-General of Eurostat, regarding the use of charts in Eurostat publications.
Thanks to that letter (kidding) things improved a lot. Some “creative” formatting is gone, and some standards seem to be in place. But standards shouldn’t mean “always a bar chart”. Often it’s a bad choice and, as we’ll see, not totally foolproof.
I’ll use several examples from a single source, the European social statistics pocketbook (PDF). Around 75% of all the charts are orange bar charts, like this one:
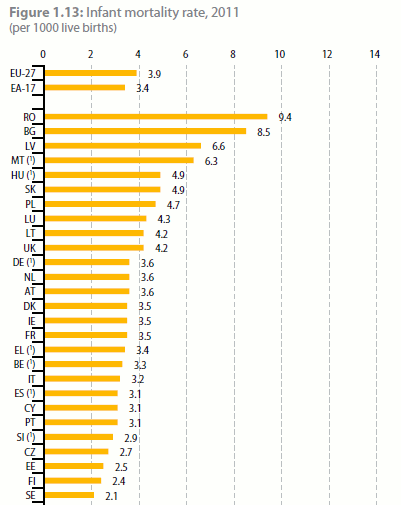
There are several things wrong with this chart, but I’ll focus on two of them only. First, the data for the EU and the Euro Area is the aggregate data of all the countries below, so they should be represented as reference lines, not as bars. Second (this one is debatable), in a bar chart, “good” should be at the top and “bad” at the bottom. If we want lower infant mortality rate, the sorting key must be reversed, starting with Sweden at the top and Romania at the bottom. When more is better a descending order should be used.
Then, a few pages later, you can find this one:
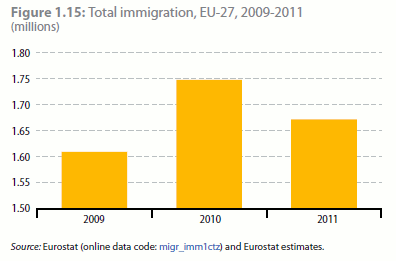
One of the reasons I don’t like bar charts is that take up too much space to represent a single data point. And yes, you should start the vertical scale at zero, but that’s a rookie mistake, right?
After a few 100% stacked bars, you get this one:
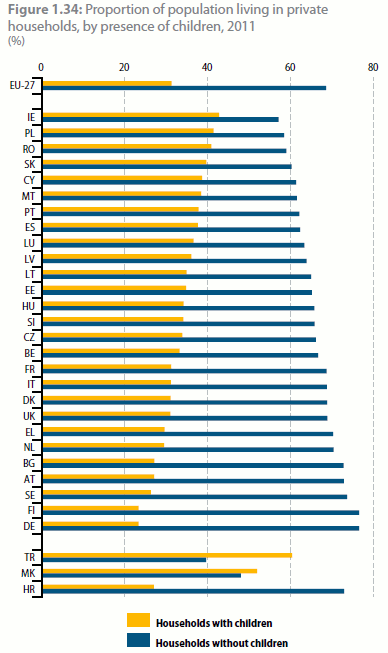
I don’t see a reason for not stacking the bars, since that’s what the author told me to expect. But mirror series should be avoided. One of them or the difference between them is much more useful.
The three countries at the bottom do not belong to the European Union, but it makes no sense to segregate them. A simple visual note would be enough and would make comparisons easier.
The light yellow is very reassuring:

The title says “people having limitations”. “None” is a useless series.
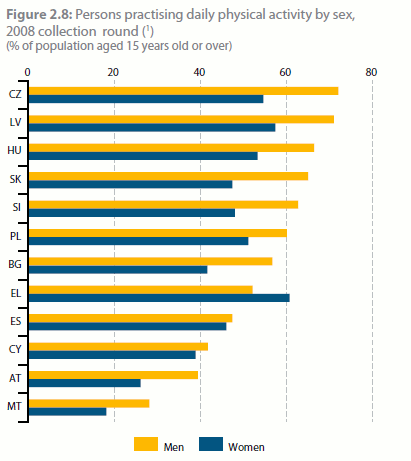
The designer was getting bored with all those horizontal bar charts, so s/he made a vertical bar chart (I can’t find a better explanation):

There is nothing wrong with this one. Just to tell you that men are coded orange and women are coded blue (there are several charts coded that way).
On a second thought, consistency is boring:
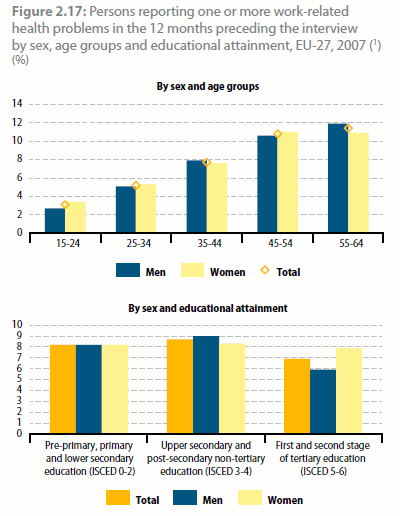
The problem with high education in the EU is that it is very hard to find:

If you an can’t have all the colors you need, maybe you should not use them at all.
I don’t really like the music of two-axis bar charts:
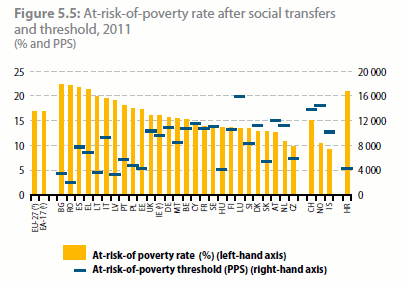
There is no relationship between the bars and the markers. Having two unrelated axis in a bar chart is as bad as not starting the scale at zero.
If you believe there is a relationship just say so with a scatter plot. I always assume that the designer is lying to me when I see two axis with unrelated scales (absolute values / market share, euros / dollars or Celsius / Fahrenheit are OK).
Can you guess how this one is ranked?
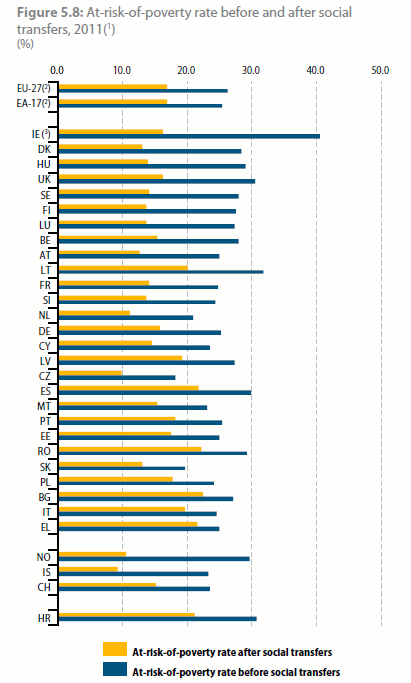
It is ranked by the difference between the two series. If this is not obvious, it’s not your fault.
So, which country has a higher percentage of detached houses?

If you have a stacked bar chart with more than two series, it becomes pretty much useless, unable to answer even the simplest questions.
Obviously they should use a bar chart instead:

So, here are some reasons why I don’t like bar charts:
- Have to be sorted;
- Very low data density (inefficient encoding);
- Very sensitive to scale breaks;
- Forces you to use color;
- Feels cluttered;
- Accepts very few data points;
- It’s difficult to compare data points in a stacked bar;
- The second axis can be misleading.
However, I do like them in sparklines (sparkbars) and in the reorderable matrix.
What about the Eurostat? Well, if this a good example of data visualization practices there, I think they still need help.
There is a contact form below. 🙂
There are definitely instances in which bar charts have become the default choice rather than the best choice. That said, Jon Peltier’s latest post (http://peltiertech.com/WordPress/charting-survey-results/) shows bar charts that, in my mind, show significant data density and don’t feel cluttered.
Thanks for this – it’s both entertaining and thought-provoking.
However, it seems to me it’s a bit misleadingly titled. The majority of your comments are about bad design decisions for the bar charts in question. In most of these cases, the optimal solution seems to me to be a better bar chart, not a different chart type.
Also, certain limitations like “low data density” aren’t really the fault of the chart so much as the “fault” of the data: if I want to visually compare child mortality rates by country in Europe, then I just don’t have a lot of numbers to compare, and the bar chart seems like the best available option.
I absolutely agree, though, that the default presentation of many things in a literal-minded bar chart is annoying. I would love to see more charts that presented the relationship between the numbers (ratio or difference) as you suggest.
Thanks again.
Paul
Better design choices would improve the charts, but in this post I’m not discussing the alternatives. It would be interesting to find a better chart type for each of the examples above. I’ll think about it.
I think William Cleveland would argue for using dot plots to allay the concerns you have with bar charts.
While I agree with most of your arguments, the solution is not good
“If you have a stacked bar chart with more than two series, it becomes pretty much useless, unable to answer even the simplest questions. Obviously they should use a bar chart instead:”
Pie charts are not better here. They are still a very bad choice. Better choice is dot-plot. In fact, in almost all of the examples above dot plot is a better option http://www.b-eye-network.com/view/2468
Love the post (and your blog in general.) Totally agree. Maybe it would be a fun project to crowdsource an improvement? If all the data is publicly available (or if it isn’t maybe they’d share it) then the whole world could work on a better way to visualize each graph in their report. I’m reminded of the article in Wired where designers re-did the medical reports.
I’d like to see figure 1.32 as a series of interactive small-multiple choropleth maps. In fact, I’d like to see a whole lot of those re-done as choropleth maps. If you’re dealing with Europe and a bunch of numbers, show me a map of Europe that helps me see the numbers. Plus, I bet you’d get a better sense of trends over space. In 5.13 you see that Latvia and Estonia are proximal, so are Belgium and Netherlands. I sense a visualizable moment in that trend.
It’s easy to get the data: under each chart or table in the PDF report there is a link that let’s you download the data from the Eurostat website in mulltiple formats.
Great examples of barts that are not so great. I agree with the critics, but sometimes a bar is essential to represent data as easy readable.